The Engine

The source of our forecasts.

The analytics behind every RST forecast: the CERS equity gauge, the Risk Barometer, relative-sentiment positioning across 70-plus macro assets, a short-term mean-reversion timing signal, the Market Narratives Monitor and the Research Signals Tracker. Each opens into its own detailed dashboard with full history and the reasoning behind each signal.

Available only to our outsourced-CIO clients.
What’s inside

Six tools, each with its own dashboard.

These are the tools we use to gauge where the Smart Money is leaning and when conditions favor action. The sample links show simplified, dated views.

CERS — the equity dial

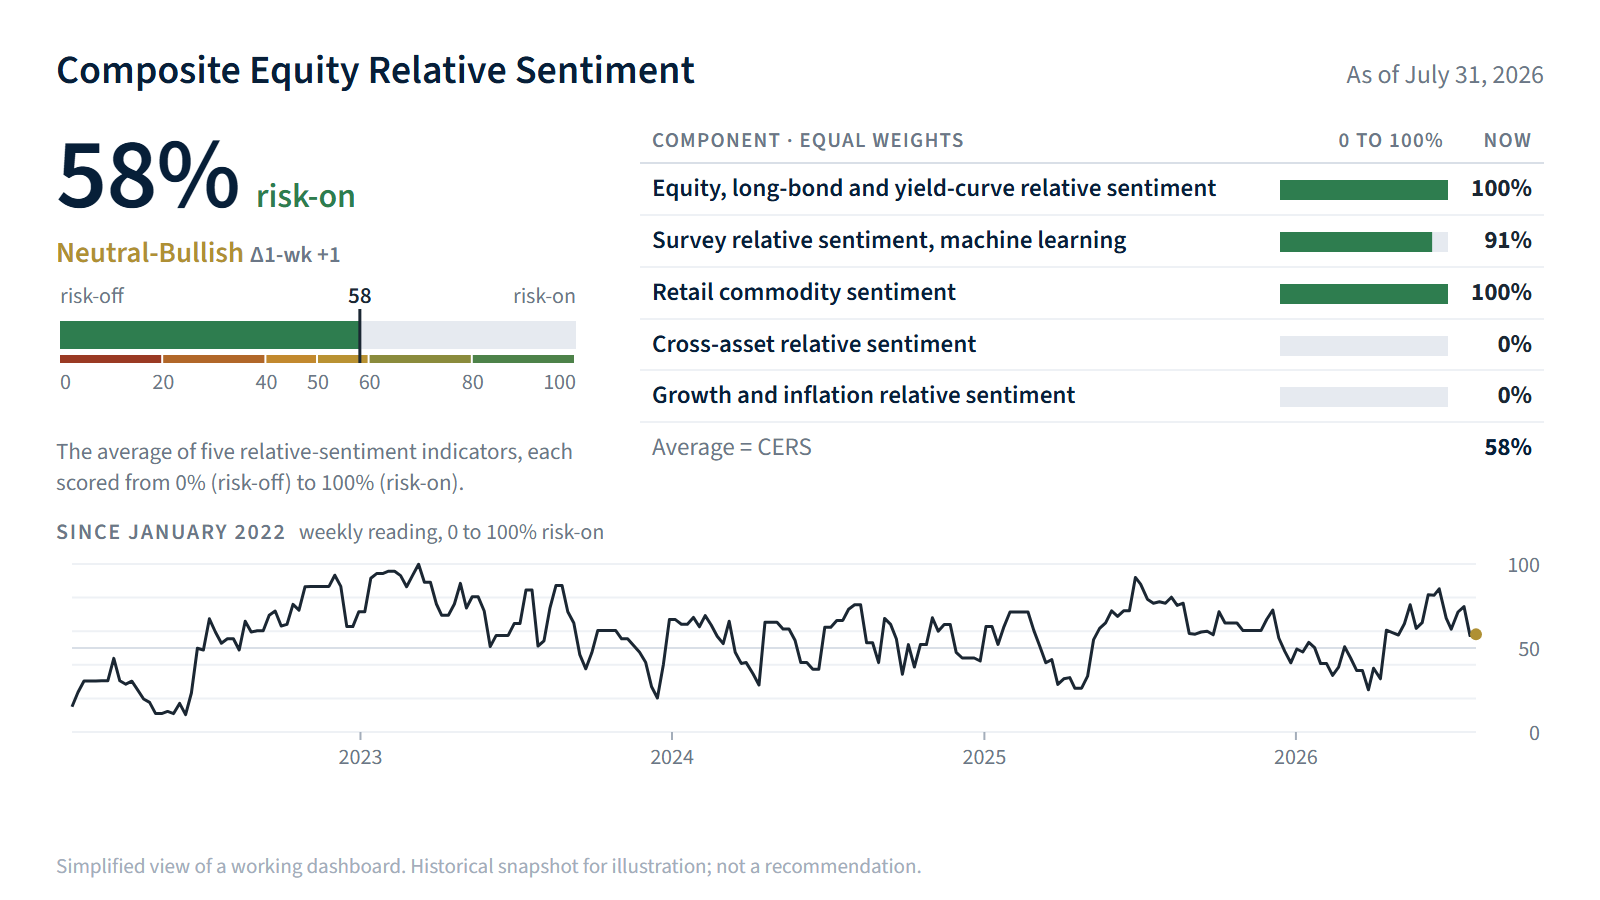
Composite Equity Relative Sentiment: our core signal, a continuous measure of risk-on versus risk-off that anchors everything else. Equity returns have tended to ebb and flow with it, with history back to 1994.

See a sample →

Risk Barometer

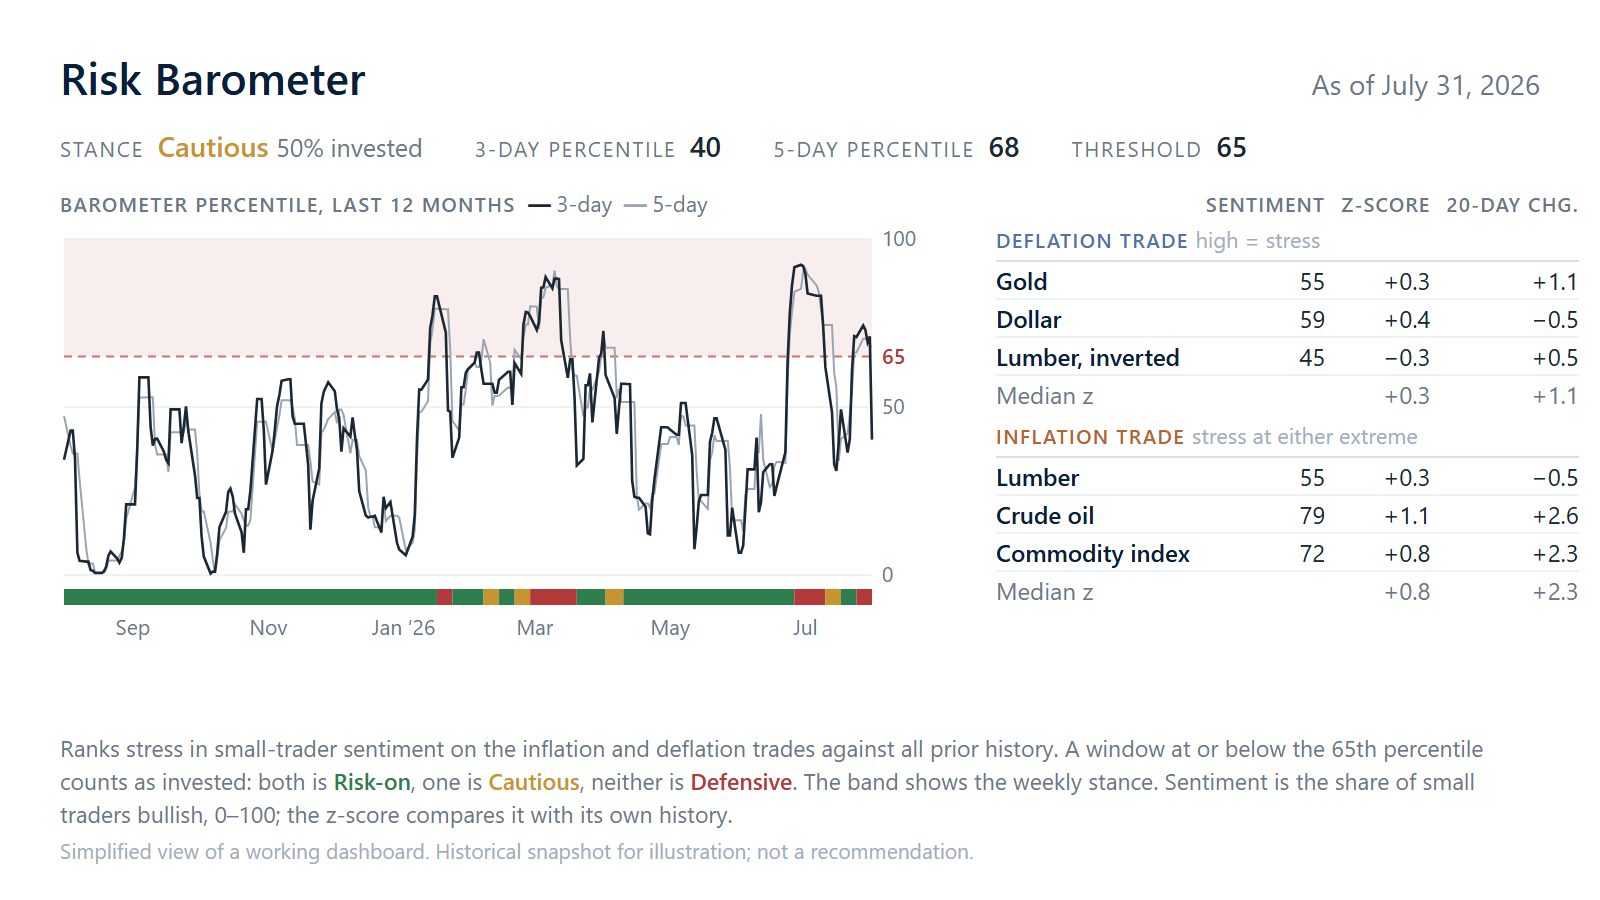
A daily read on macro stress that can override our CERS signal. It acts as a circuit-breaker when the broader environment turns hostile.

See a sample →

Positioning Dashboard

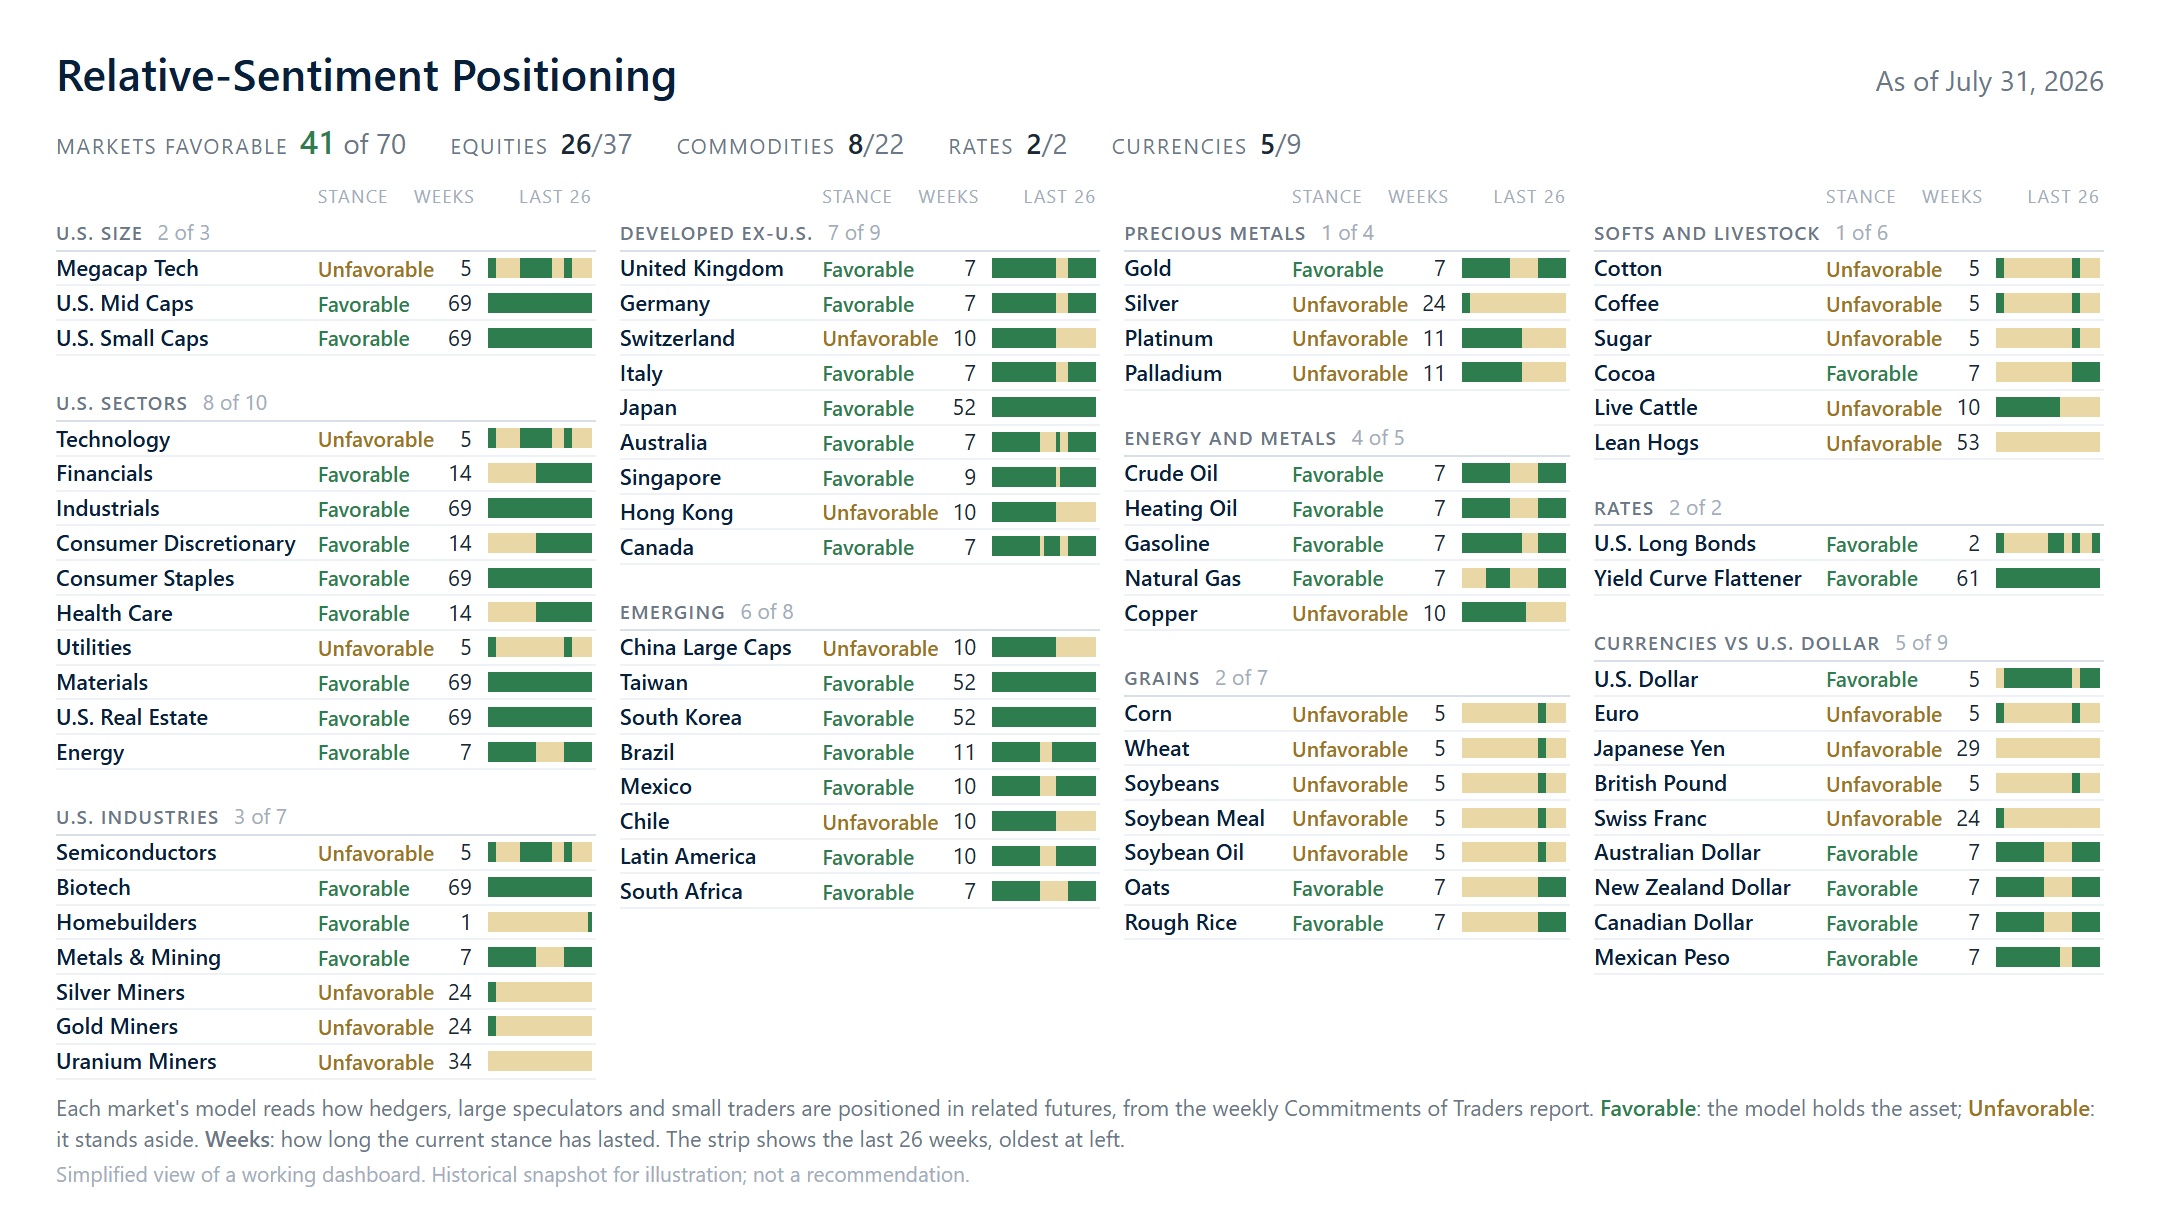
Favorable or unfavorable relative-sentiment readings across 70-plus macro assets (equities by region, sector and country, plus bonds, spreads, currencies, precious metals, commodities and more), with the statistics behind each signal tracked in detail.

See a sample →

Mean-Reversion timing

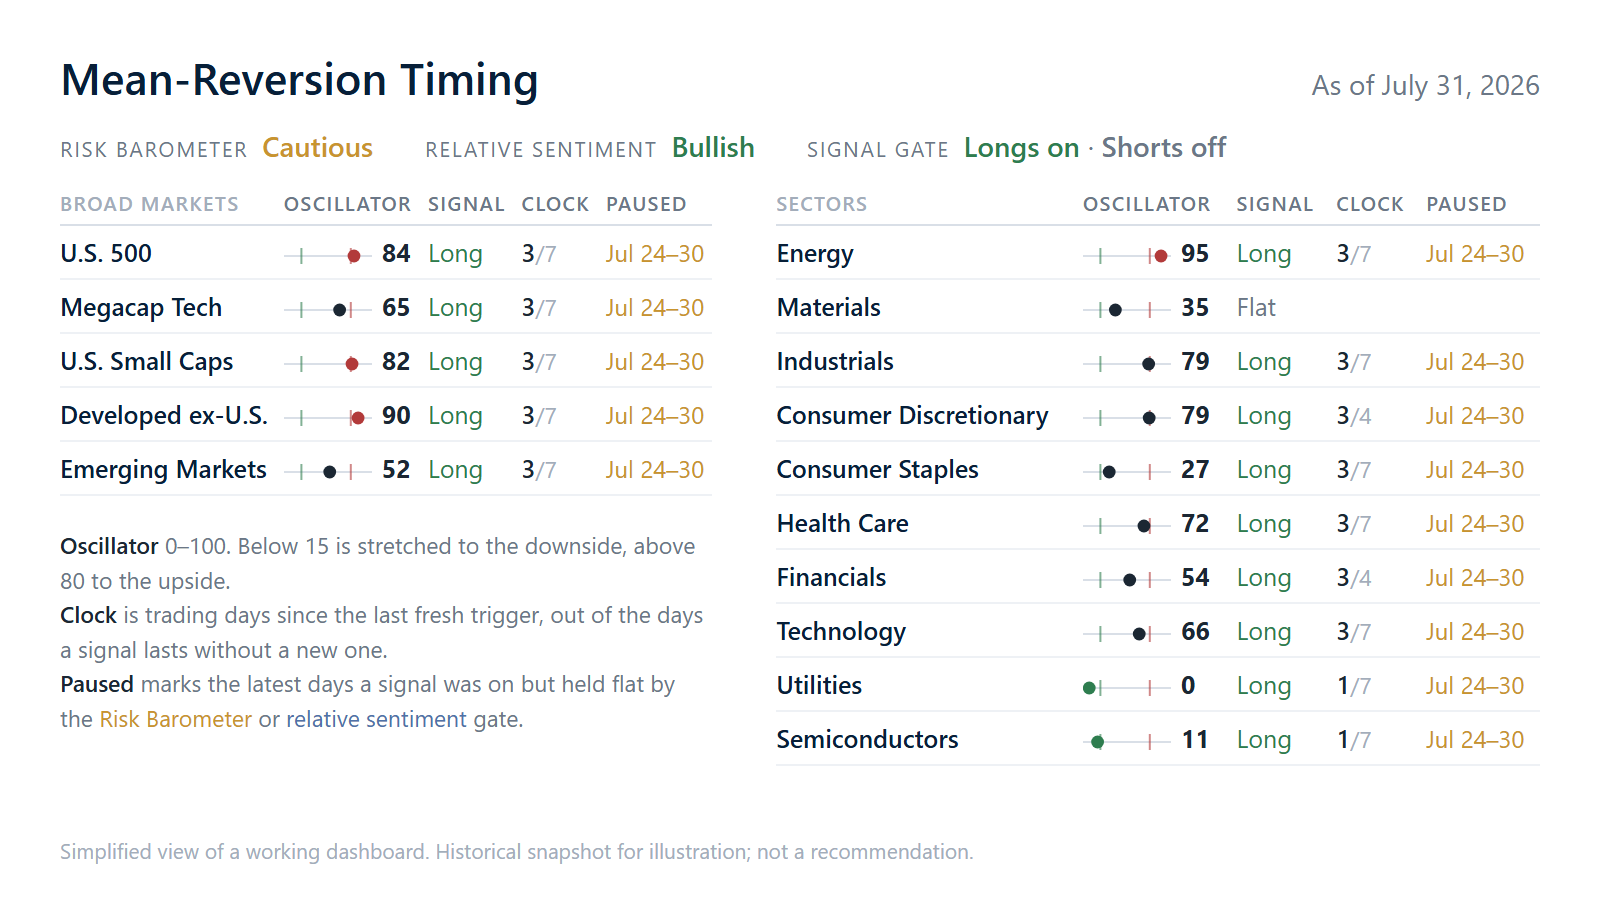
A short-term equity signal to help time entries and exits. It monitors whether conditions favor stepping into a position now or waiting for a better spot, which helps answer the question of when to act as well as what to own.

See a sample →

Market Narratives Monitor

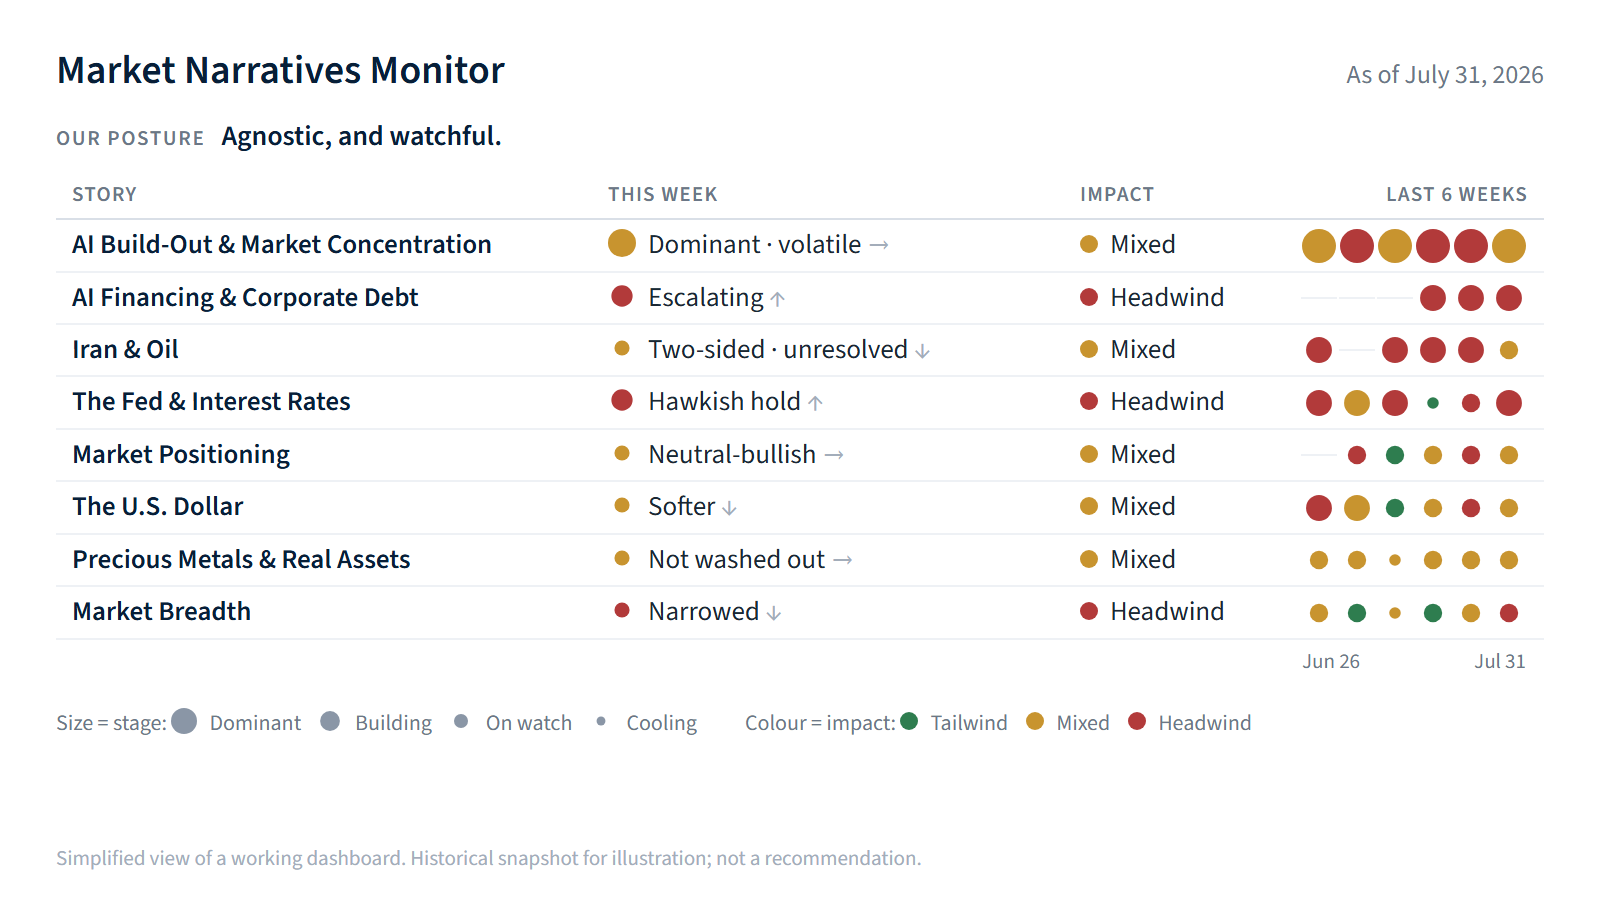
The stories driving markets, tracked as they emerge, build, peak and fade, so you can see what markets are responding to and when that consensus might change.

See a sample →

Research Signals Tracker

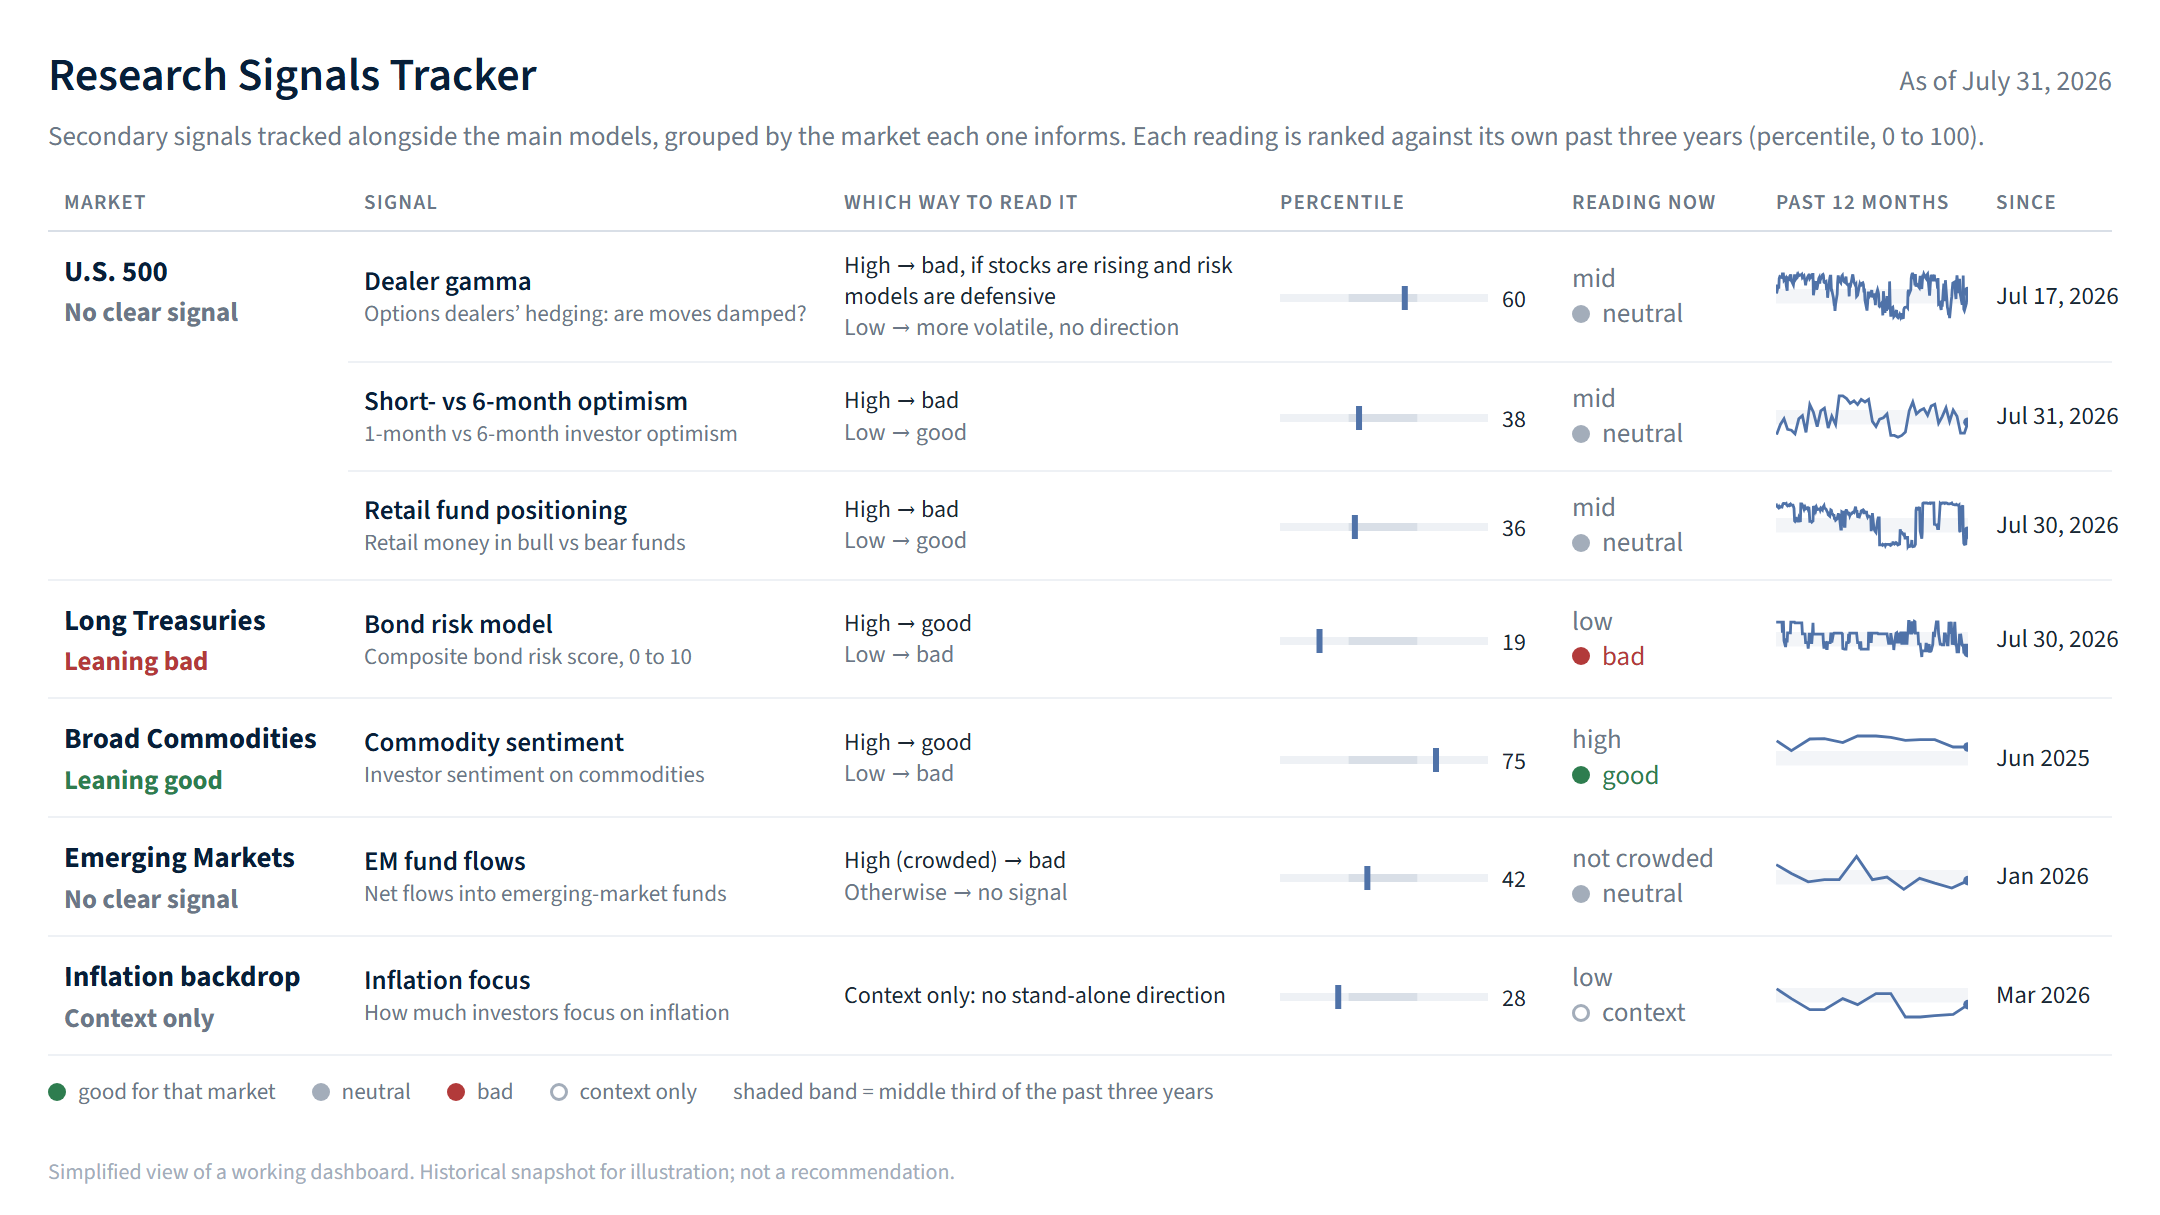
A bench of secondary signals (dealer hedging, retail fund positioning, investor optimism, fund flows and bond risk) that have historically carried information but overlap with what our core models already capture. We use them as a second opinion on the macro backdrop.

See a sample →
A closer look

Inside the Engine.

Simplified views of six working dashboards.

Positioning Dashboard
Relative-sentiment positioning across 70 markets as of July 31, 2026: stance (favorable or unfavorable), weeks in stance and a 26-week strip for each market.
Market Narratives Monitor
Market Narratives Monitor as of July 31, 2026: eight market stories with this week's tag, impact on stocks and the last six weeks.
Risk Barometer
Risk Barometer as of July 31, 2026: stance Cautious, 3-day and 5-day percentiles against the 65 threshold, with a 12-month chart and small-trader sentiment table.
Mean-Reversion Timing
Mean-Reversion Timing as of July 31, 2026: oscillator reading, signal, clock and latest pause for five broad markets and ten sectors.
CERS — Composite Equity Relative Sentiment
Composite Equity Relative Sentiment as of July 31, 2026: 58% risk-on (Neutral-Bullish), its five components, and the weekly reading since January 2022.
Research Signals Tracker
Research Signals Tracker as of July 31, 2026: secondary signals grouped by the market each one informs, with how to read each, its percentile against the past three years, the reading now, a 12-month path and the date the current state began.

Snapshots as of July 31, 2026, for illustration only. Click any image to enlarge. The working versions include more columns, history and charts than can be shown here.

Build your own white-label version

Create fully branded, client-ready reports. Upload your firm name, logo, and brand colors, then export any view to PDF. Your clients see your firm’s brand while you draw on our research behind the scenes.

Illustrative — sample branding
ACME ADVISORS Client report
Illustrative sample
Weekly equity sentiment check
Sample white-label report: the CERS snapshot as of July 31, 2026, under a fictional advisory firm's logo.
Prepared by Acme AdvisorsAnalytics by Relative Sentiment Technologies
Working with us

A wider view for your process.

These dashboards are meant to add to your own investment process, with a broader read on sentiment and positioning across markets. Access is reserved for our outsourced-CIO clients and isn’t sold separately.

Explore the OCIO engagement →
A limited number of engagements.