These are the tools we use to gauge where the Smart Money is leaning and when conditions favor action. The sample links show simplified, dated views.
CERS — the equity dial
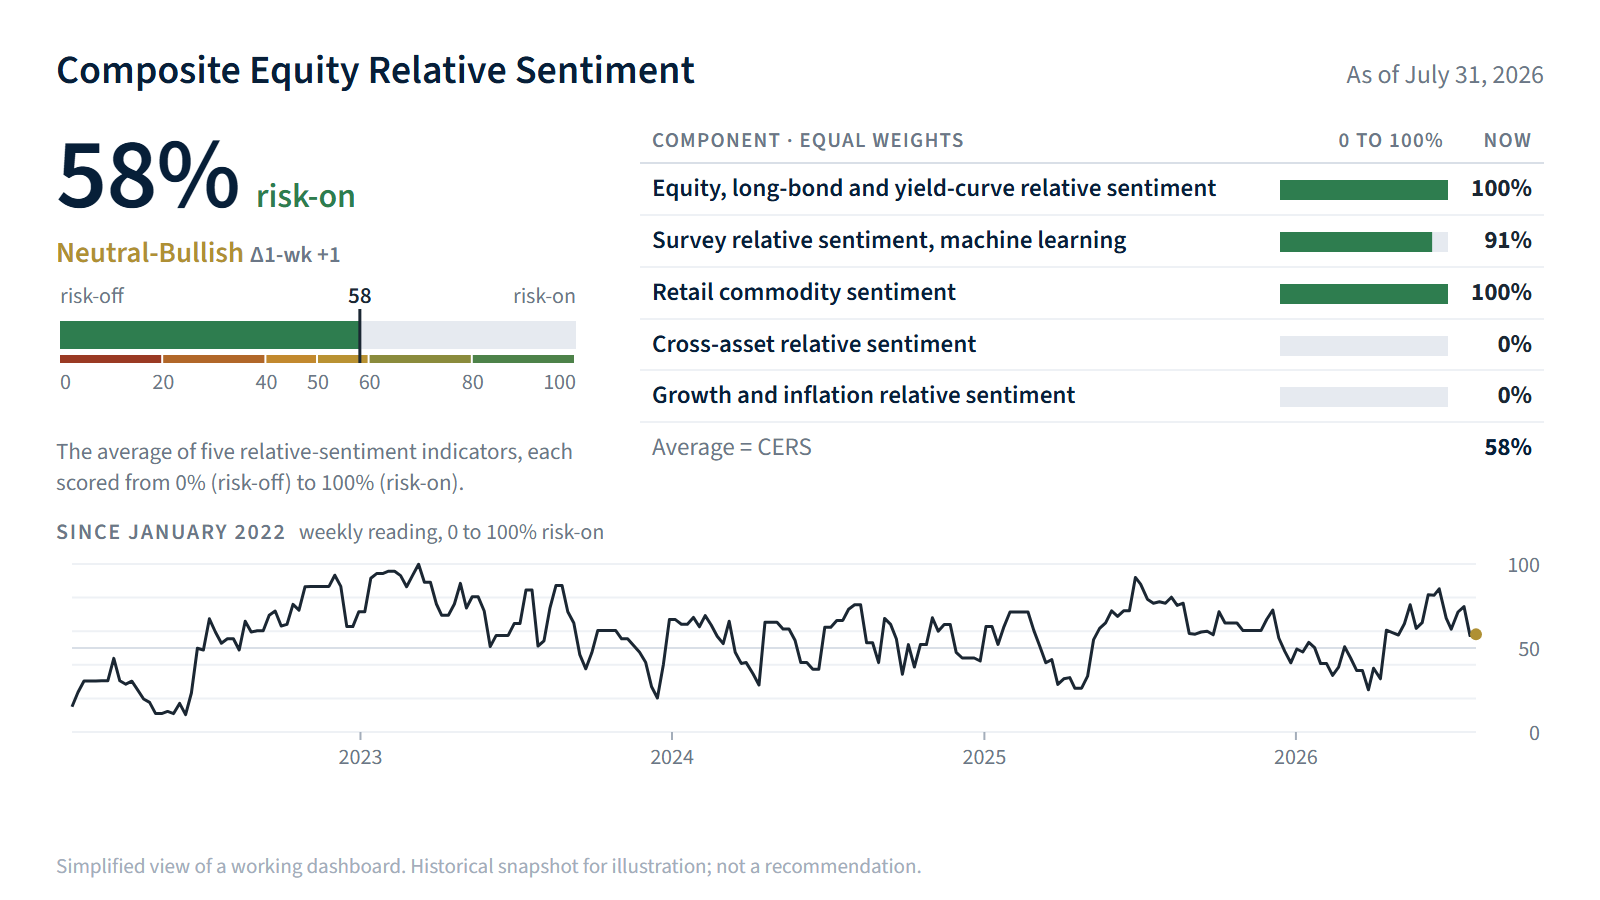
Composite Equity Relative Sentiment: our core signal, a continuous measure of risk-on versus risk-off that anchors everything else. Equity returns have tended to ebb and flow with it, with history back to 1994.
See a sample →Risk Barometer
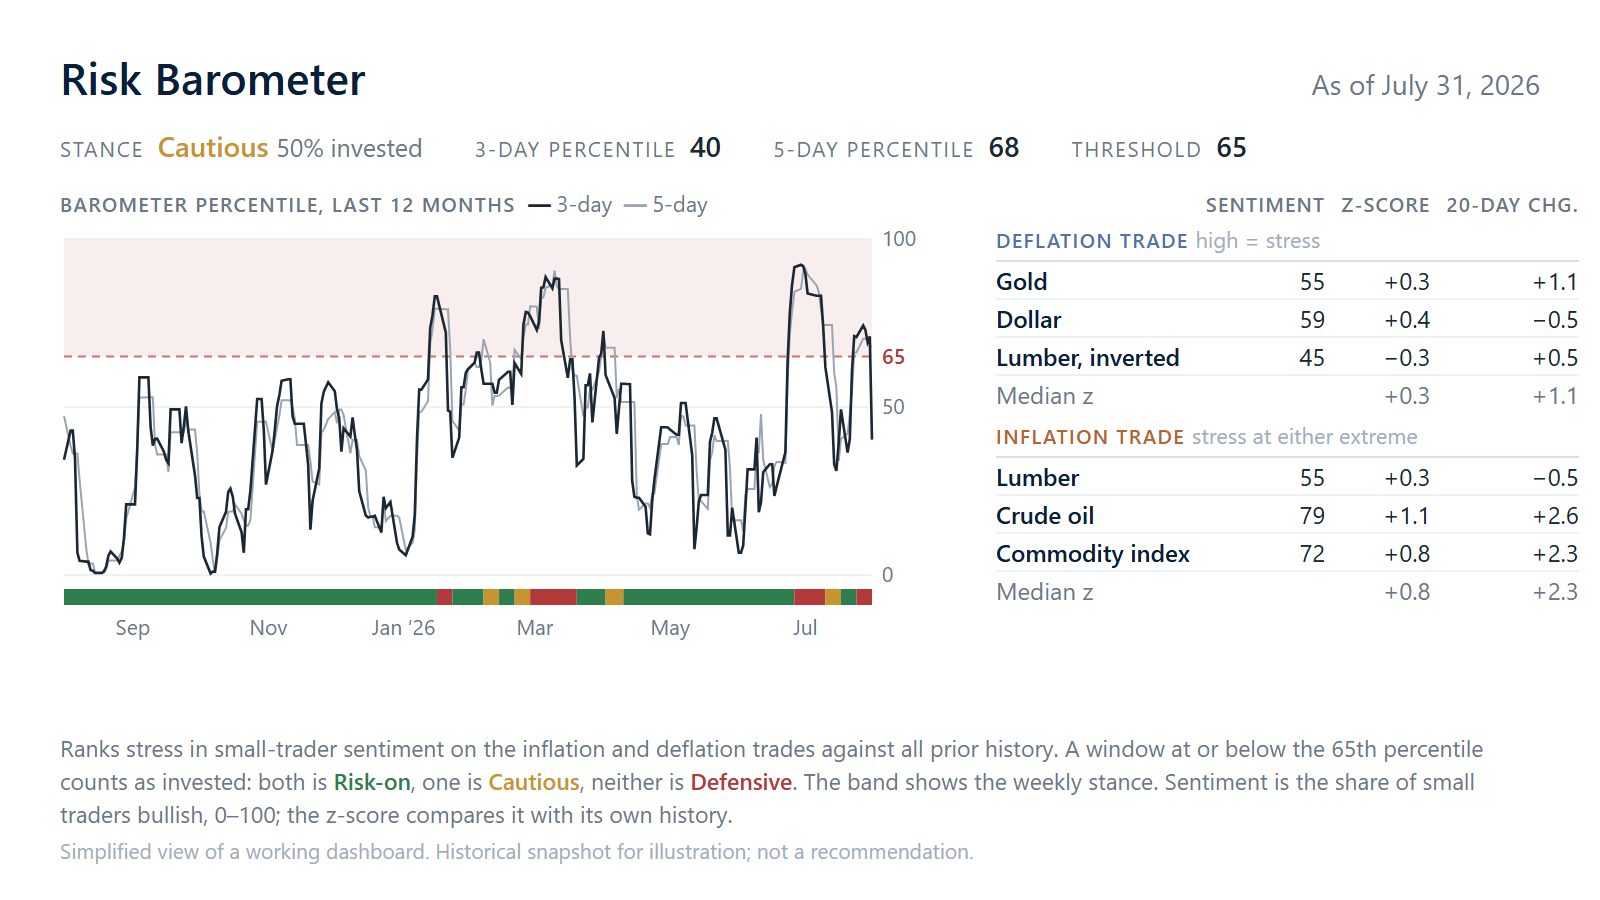
A daily read on macro stress that can override our CERS signal. It acts as a circuit-breaker when the broader environment turns hostile.
See a sample →Positioning Dashboard
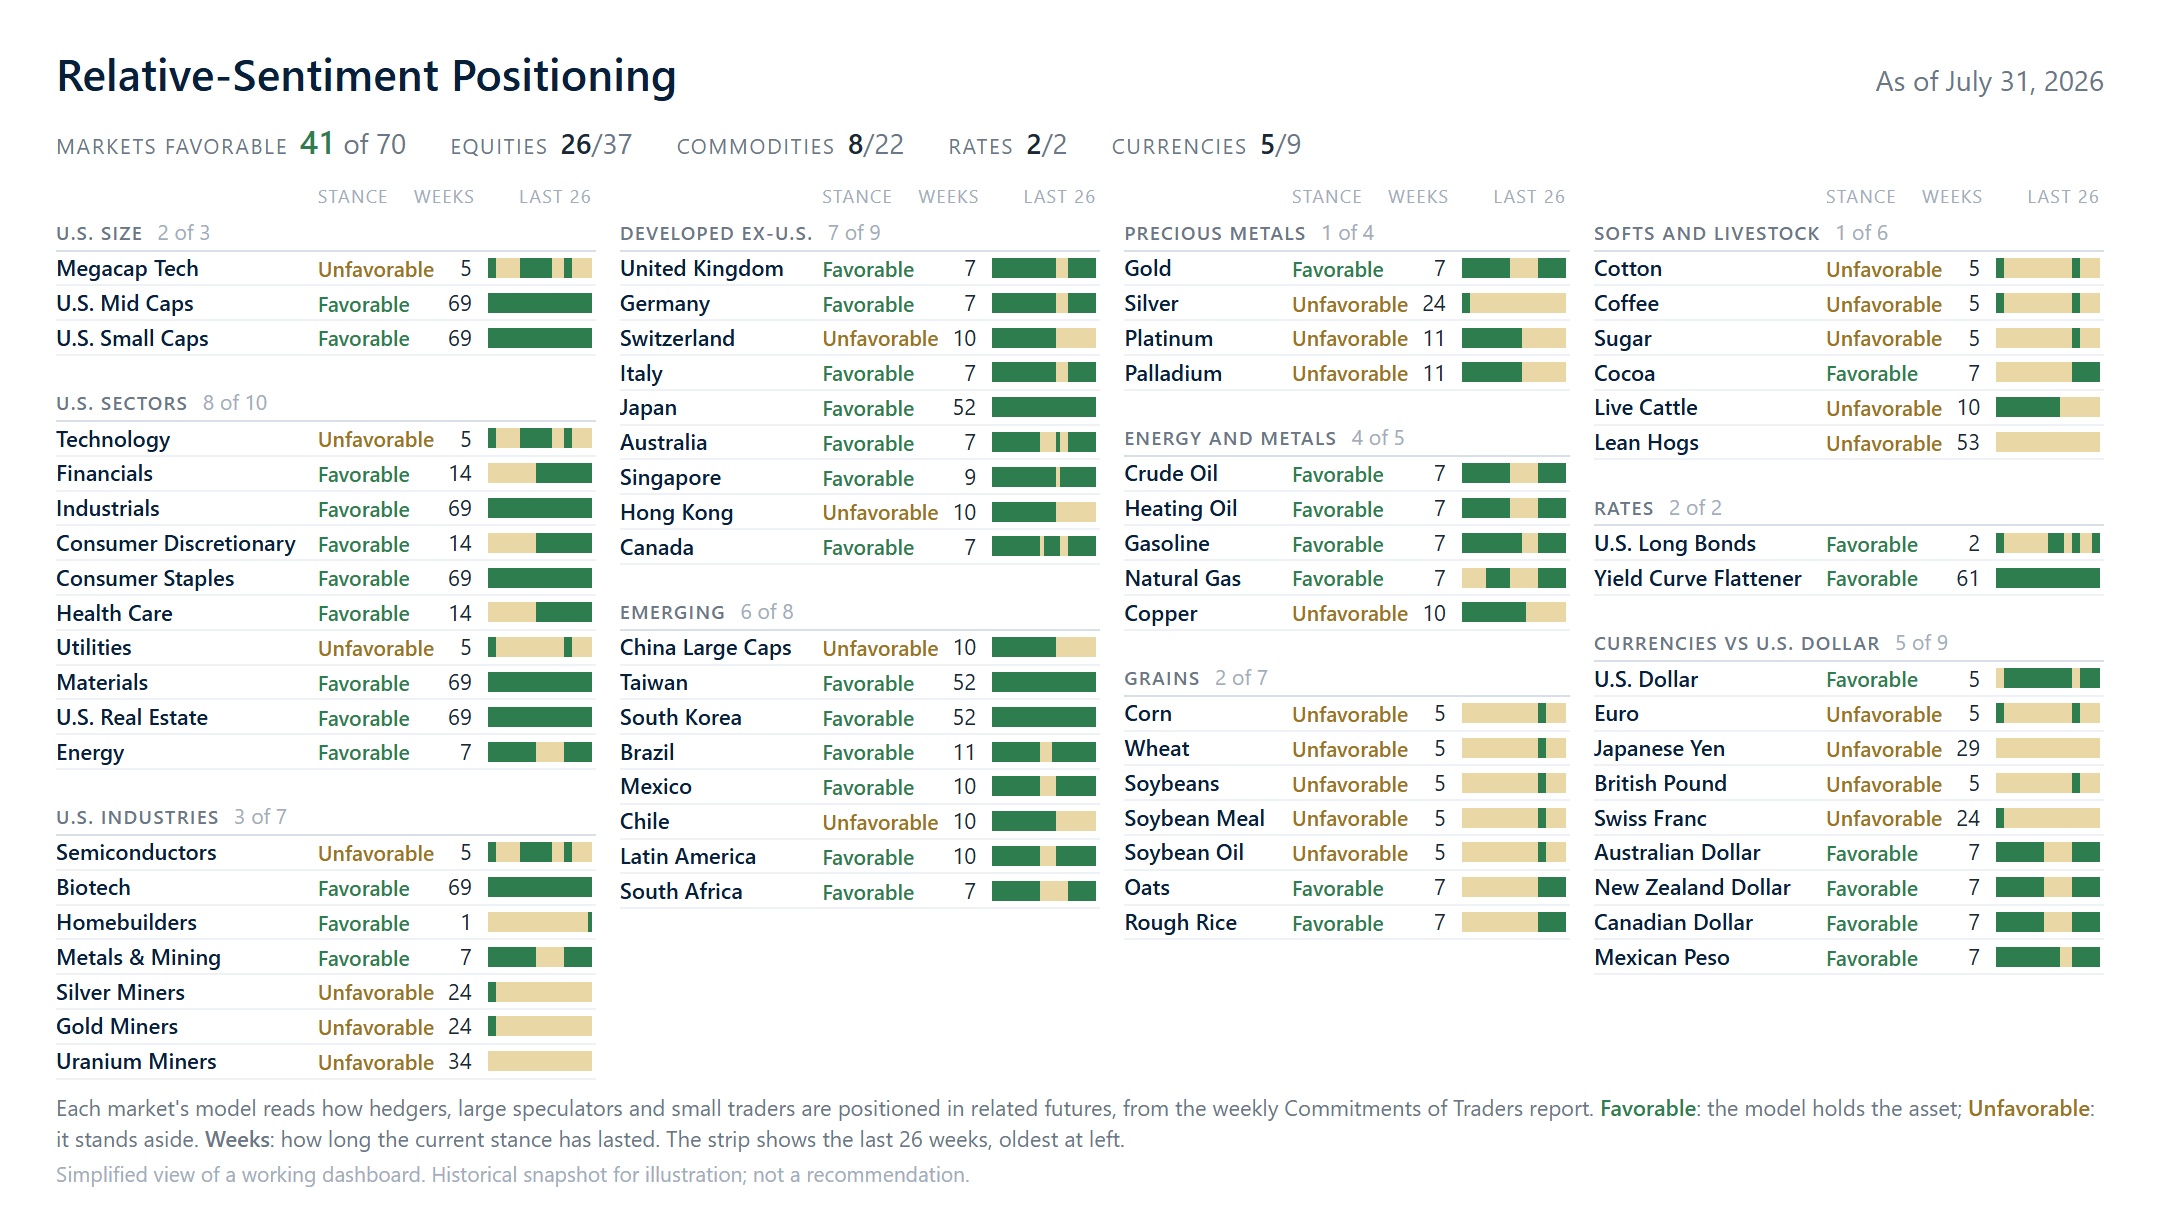
Favorable or unfavorable relative-sentiment readings across 70-plus macro assets (equities by region, sector and country, plus bonds, spreads, currencies, precious metals, commodities and more), with the statistics behind each signal tracked in detail.
See a sample →Mean-Reversion timing
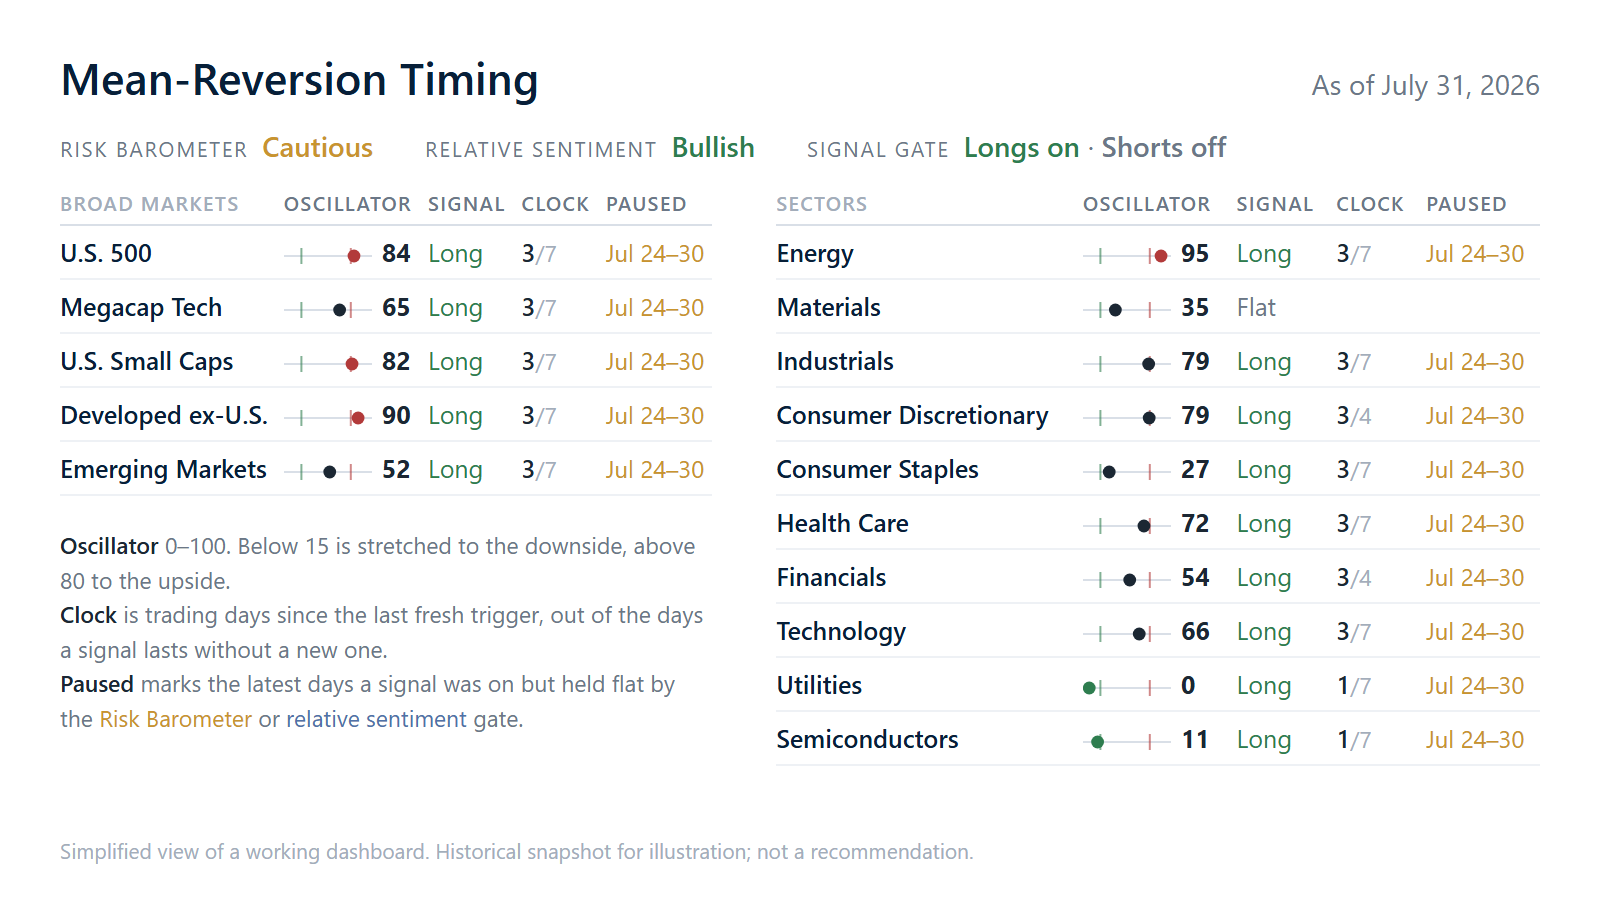
A short-term equity signal to help time entries and exits. It monitors whether conditions favor stepping into a position now or waiting for a better spot, which helps answer the question of when to act as well as what to own.
See a sample →Market Narratives Monitor
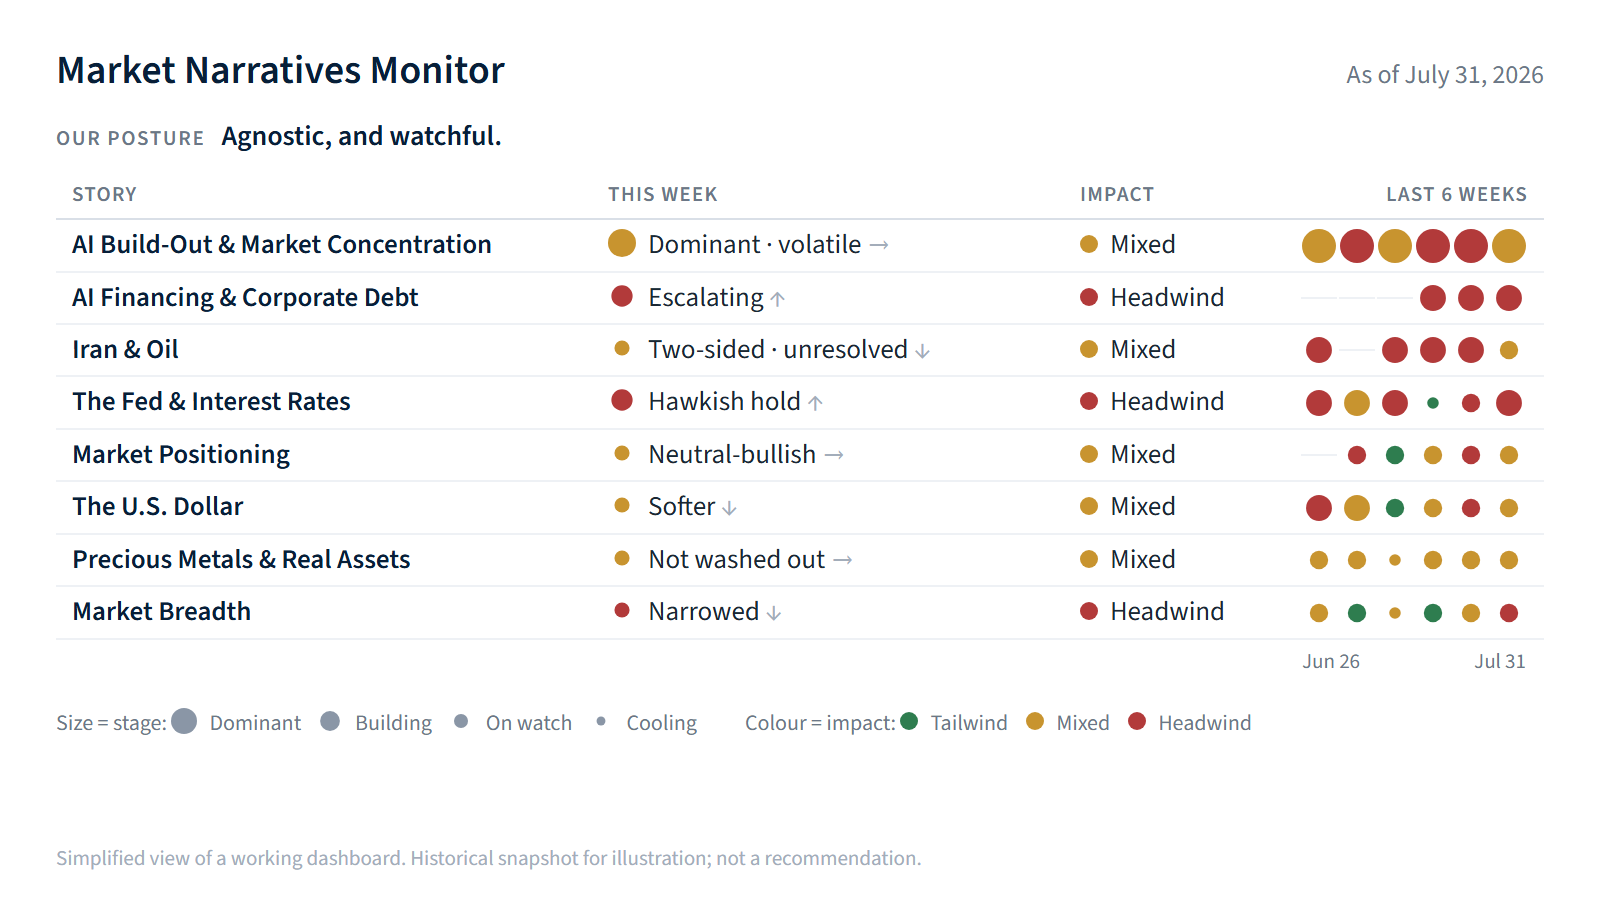
The stories driving markets, tracked as they emerge, build, peak and fade, so you can see what markets are responding to and when that consensus might change.
See a sample →Research Signals Tracker
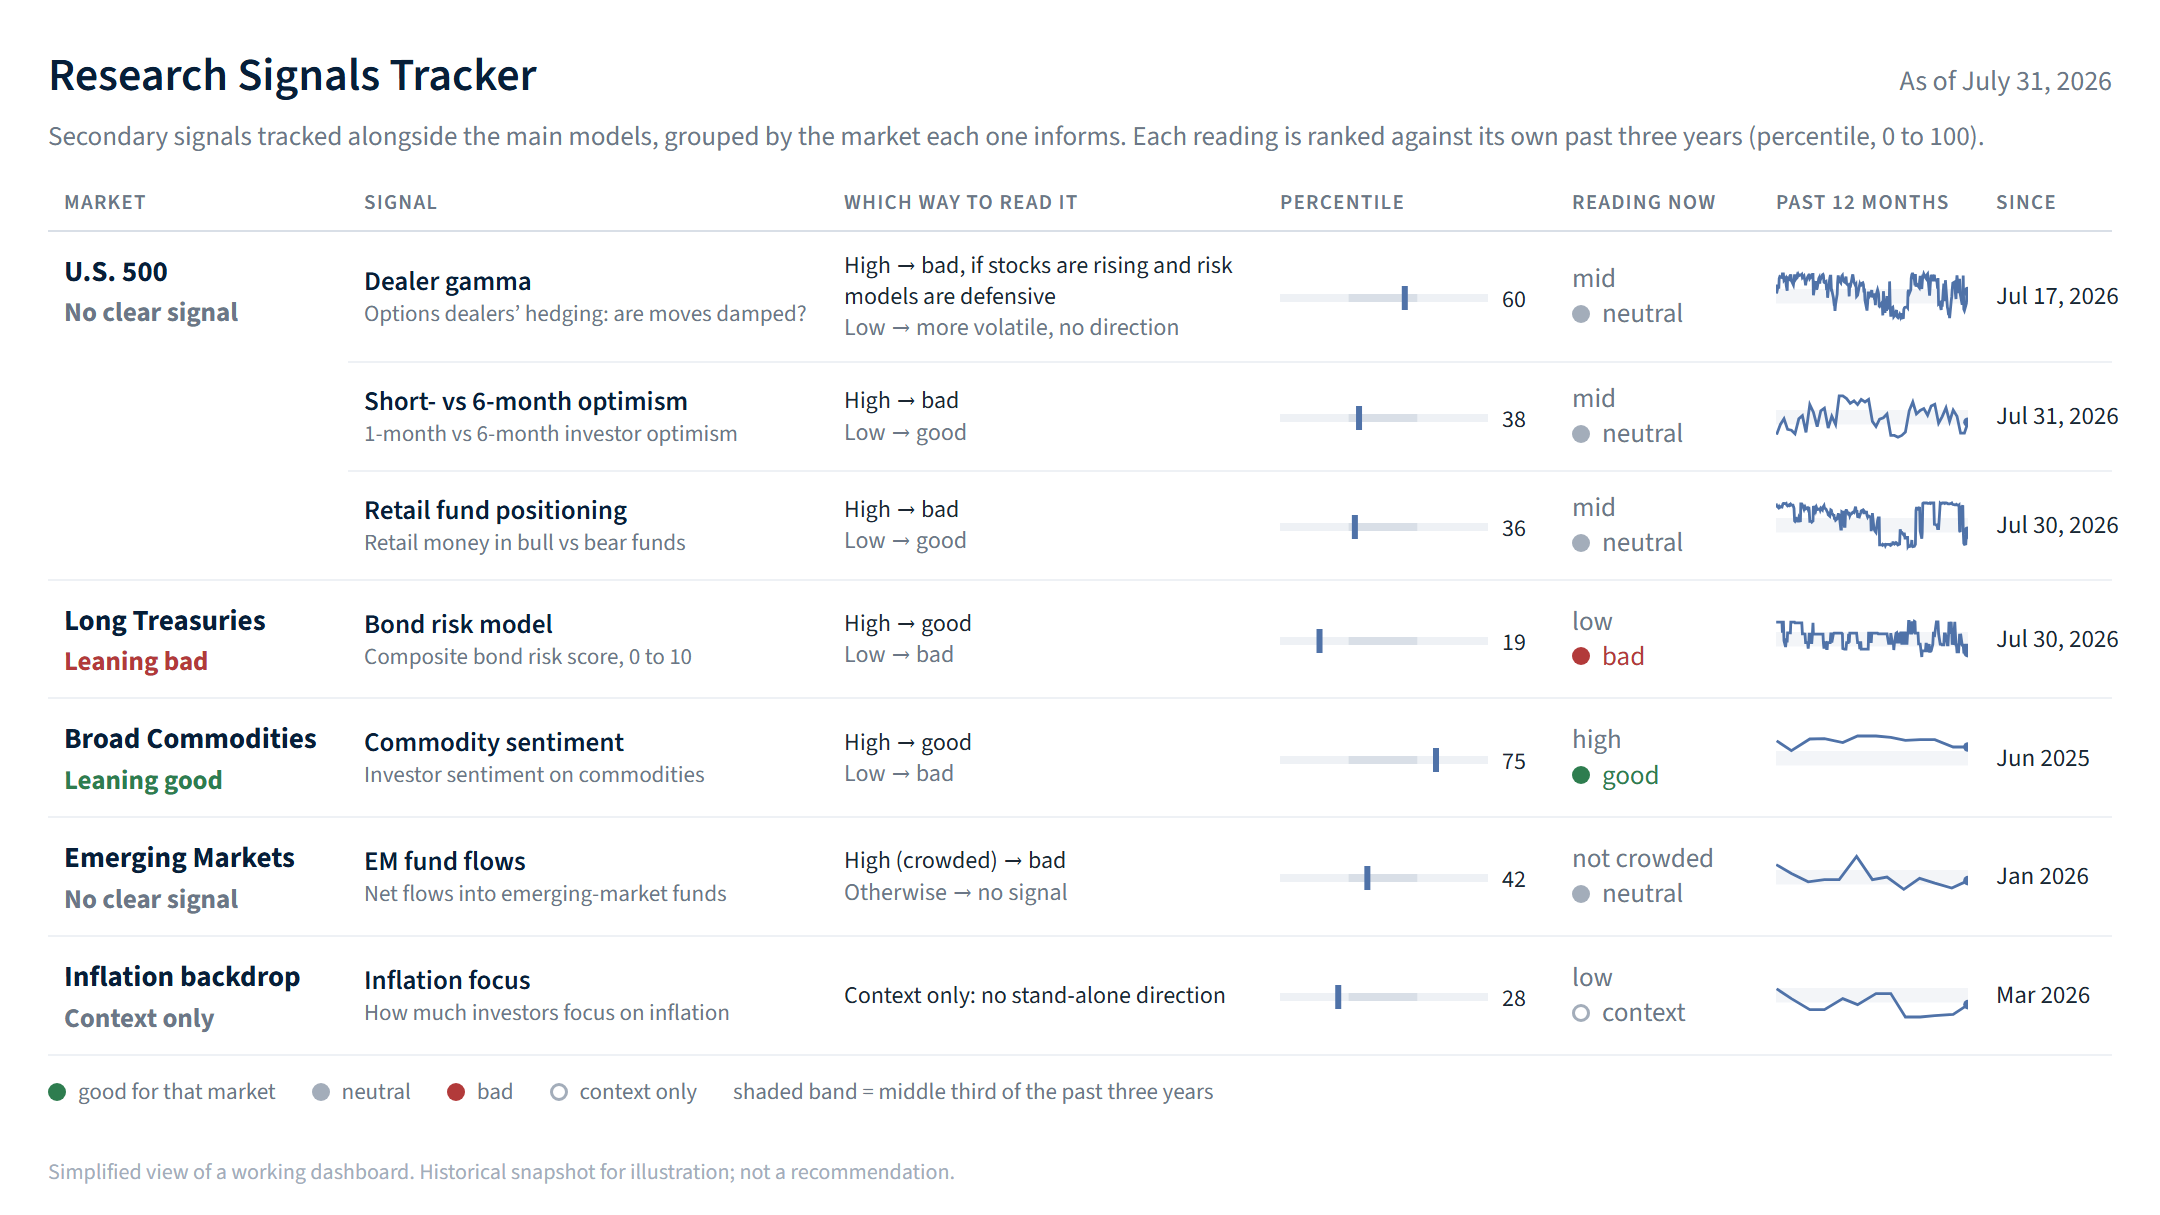
A bench of secondary signals (dealer hedging, retail fund positioning, investor optimism, fund flows and bond risk) that have historically carried information but overlap with what our core models already capture. We use them as a second opinion on the macro backdrop.
See a sample →