Relative Sentiment Technologies

The concept of the Smart Money exists for a reason.

There has always been a divide between those in the know, the so-called Smart Money, and the crowd on the outside looking in, who aren’t privy to market-moving information.

Relative sentiment reads the footprints the Smart Money leaves in its positioning, a trail that hints at the path ahead for asset prices.

Follow the pros, fade the Joes.
See the evidenceAdvisory inquiries
Or subscribe to the weekly report →
The idea

Markets are a tug-of-war between institutions and the crowd.

Pensions, endowments, insurers, large asset managers and investment banks on one side; a broader crowd that chases strength and sells weakness on the other. At extremes the two are usually on opposite sides, and on balance the better-resourced, better-informed side has been the one worth following. Relative sentiment measures that divide directly. Sentiment that everyone shares carries little information; the useful signal comes from the difference between the two groups.

The difference between institutional and crowd positioning.
the difference = the signal Bearish Bullish The crowd chases strength, sells weakness Institutions better informed, better resourced
The evidence

Why we track relative sentiment.

There is an intuitive reason relative sentiment should work. Institutions have structural advantages the crowd doesn’t: better information networks, deeper pools of human capital, and a hand in shaping the narratives everyone else reacts to. The question is whether that edge holds up to scrutiny. Measured against one widely cited set of criteria for a genuine factor, we believe it does:

0 100% CERS — equity dial
Composite Equity Relative Sentiment (CERS) — a reading of how institutions are positioned in equities versus the crowd.

Time-tested

The idea of the Smart Money is as old as markets themselves. The evidence for it has held up out of sample, including in independent replications extending the work to the present.

Scrutinized

Vetted, replicated and debated in top academic journals, including 18 papers in the top three finance journals between 1999 and 2015.

Universal

Documented across dozens of countries and regions, and across asset classes beyond U.S. equities.

Robust

Has held up under changes to how the signal is constructed, and across different data sets and time periods.

Persistent

There’s a credible reason for it to continue: institutions’ structural advantages, and the crowd’s habit of chasing strength and selling weakness.

Emphatic

t-statistics strong enough to clear the stricter thresholds needed to account for data-snooping.

Third-party articles, research reviews, and other publications are provided for informational purposes only. References to, or links to, such content should not be construed as an endorsement, recommendation, testimonial, or approval of Relative Sentiment Technologies, LLC (the “Adviser”), its personnel, investment strategies, products, or services. Certain referenced content has been published by Alpha Architect, an investment research and asset management organization with which the Adviser has a business relationship. Specifically, Wes Gray, the founder and CEO of Alpha Architect, is also a co-founder of Relative Sentiment Technologies, LLC. As a result, publications by Alpha Architect should not be viewed as independent third-party assessments of the Adviser. The authors and publishers of the referenced content are not clients of the Adviser, although they may invest in the ETF sub-advised by the Adviser. The Adviser has not paid cash or non-cash compensation to the authors or publishers in exchange for the publication, review, or commentary, unless otherwise specifically disclosed.

Relative sentiment is a tendency, not a rule; no factor is guaranteed to persist. Evidence above draws on published academic and practitioner research, linked throughout.

Ways to add relative sentiment to your investment process

The research is the foundation. How to use it is up to you.

Outsourced CIO

Your outsourced investment committee: weekly market calls, in-depth macro reviews, white-labeled reports, positioning guidance across asset classes, and full access to our analytical engine, plus a secular real-assets view held since 2022.

Explore advisory →

Our ETF

Our relative-sentiment approach in one tax-efficient ETF. It lets you stay tactical across markets without the tax friction that doing it yourself might otherwise trigger. Live since 2022.

See the fund →

The Report

Our weekly view of the market landscape and where positioning stands, delivered to your inbox.

Subscribe →
The Engine

The analytics behind
our forecasts.

The dashboards we use to monitor relative sentiment and positioning, each with its full history and the reasoning behind it. Our outsourced-CIO clients see the same dashboards we do.

  • CERS — Composite Equity Relative Sentiment: our core signal, a continuous measure of risk-on versus risk-off. It anchors everything else; equity returns have tended to ebb and flow with it.
  • Risk Barometer — a daily measure of macro stress that can override our CERS signal.
  • Positioning dashboard — favorable or unfavorable relative-sentiment readings across 70-plus assets: equities by cap, region, country and sector, plus bonds, currencies, commodities, precious metals, spreads and more.
  • Mean-reversion dashboard — a timing read for entries and exits, highlighting when conditions favor stepping in and when they favor waiting.
  • Market Narratives Monitor — the stories driving markets, tracked as they emerge, build, peak, and fade. See what markets are responding to, and when that consensus might change.
  • Research Signals Tracker — secondary signals that have historically carried information but overlap with our core models, used as a second opinion on the macro backdrop.
  • Build your own white-label report — upload your firm name, logo, and brand colors, then export any view to PDF.
Explore the engagement → Tour the Engine →
Reserved for our outsourced-CIO clients.
CERS DashboardSnapshot · July 31, 2026
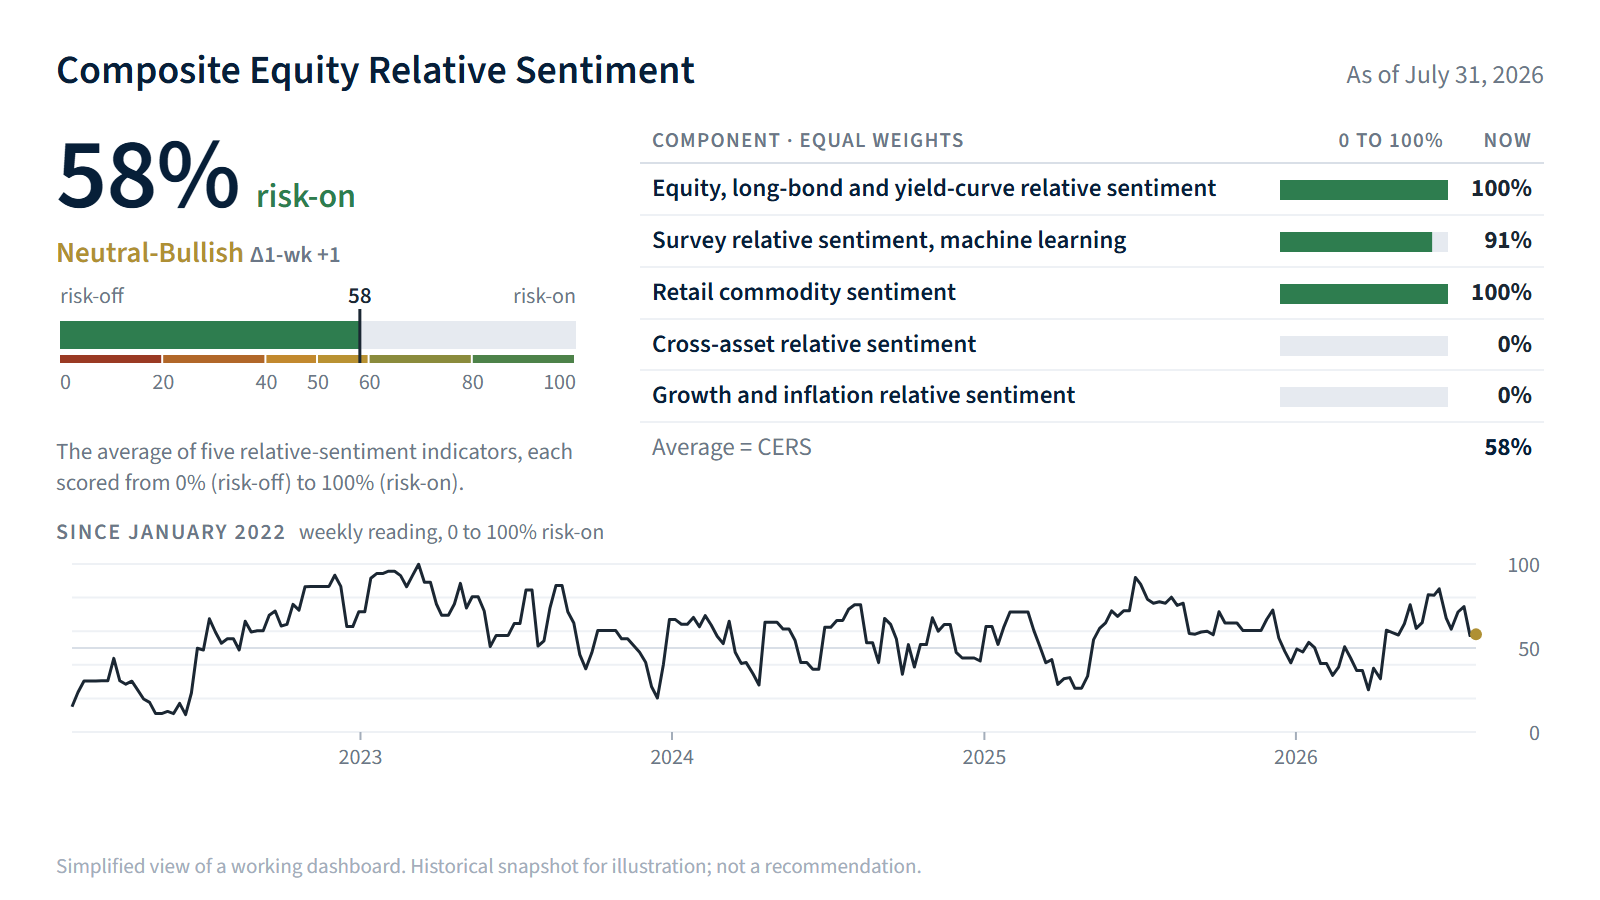
Composite Equity Relative Sentiment snapshot as of July 31, 2026
Positioning DashboardSnapshot · July 31, 2026
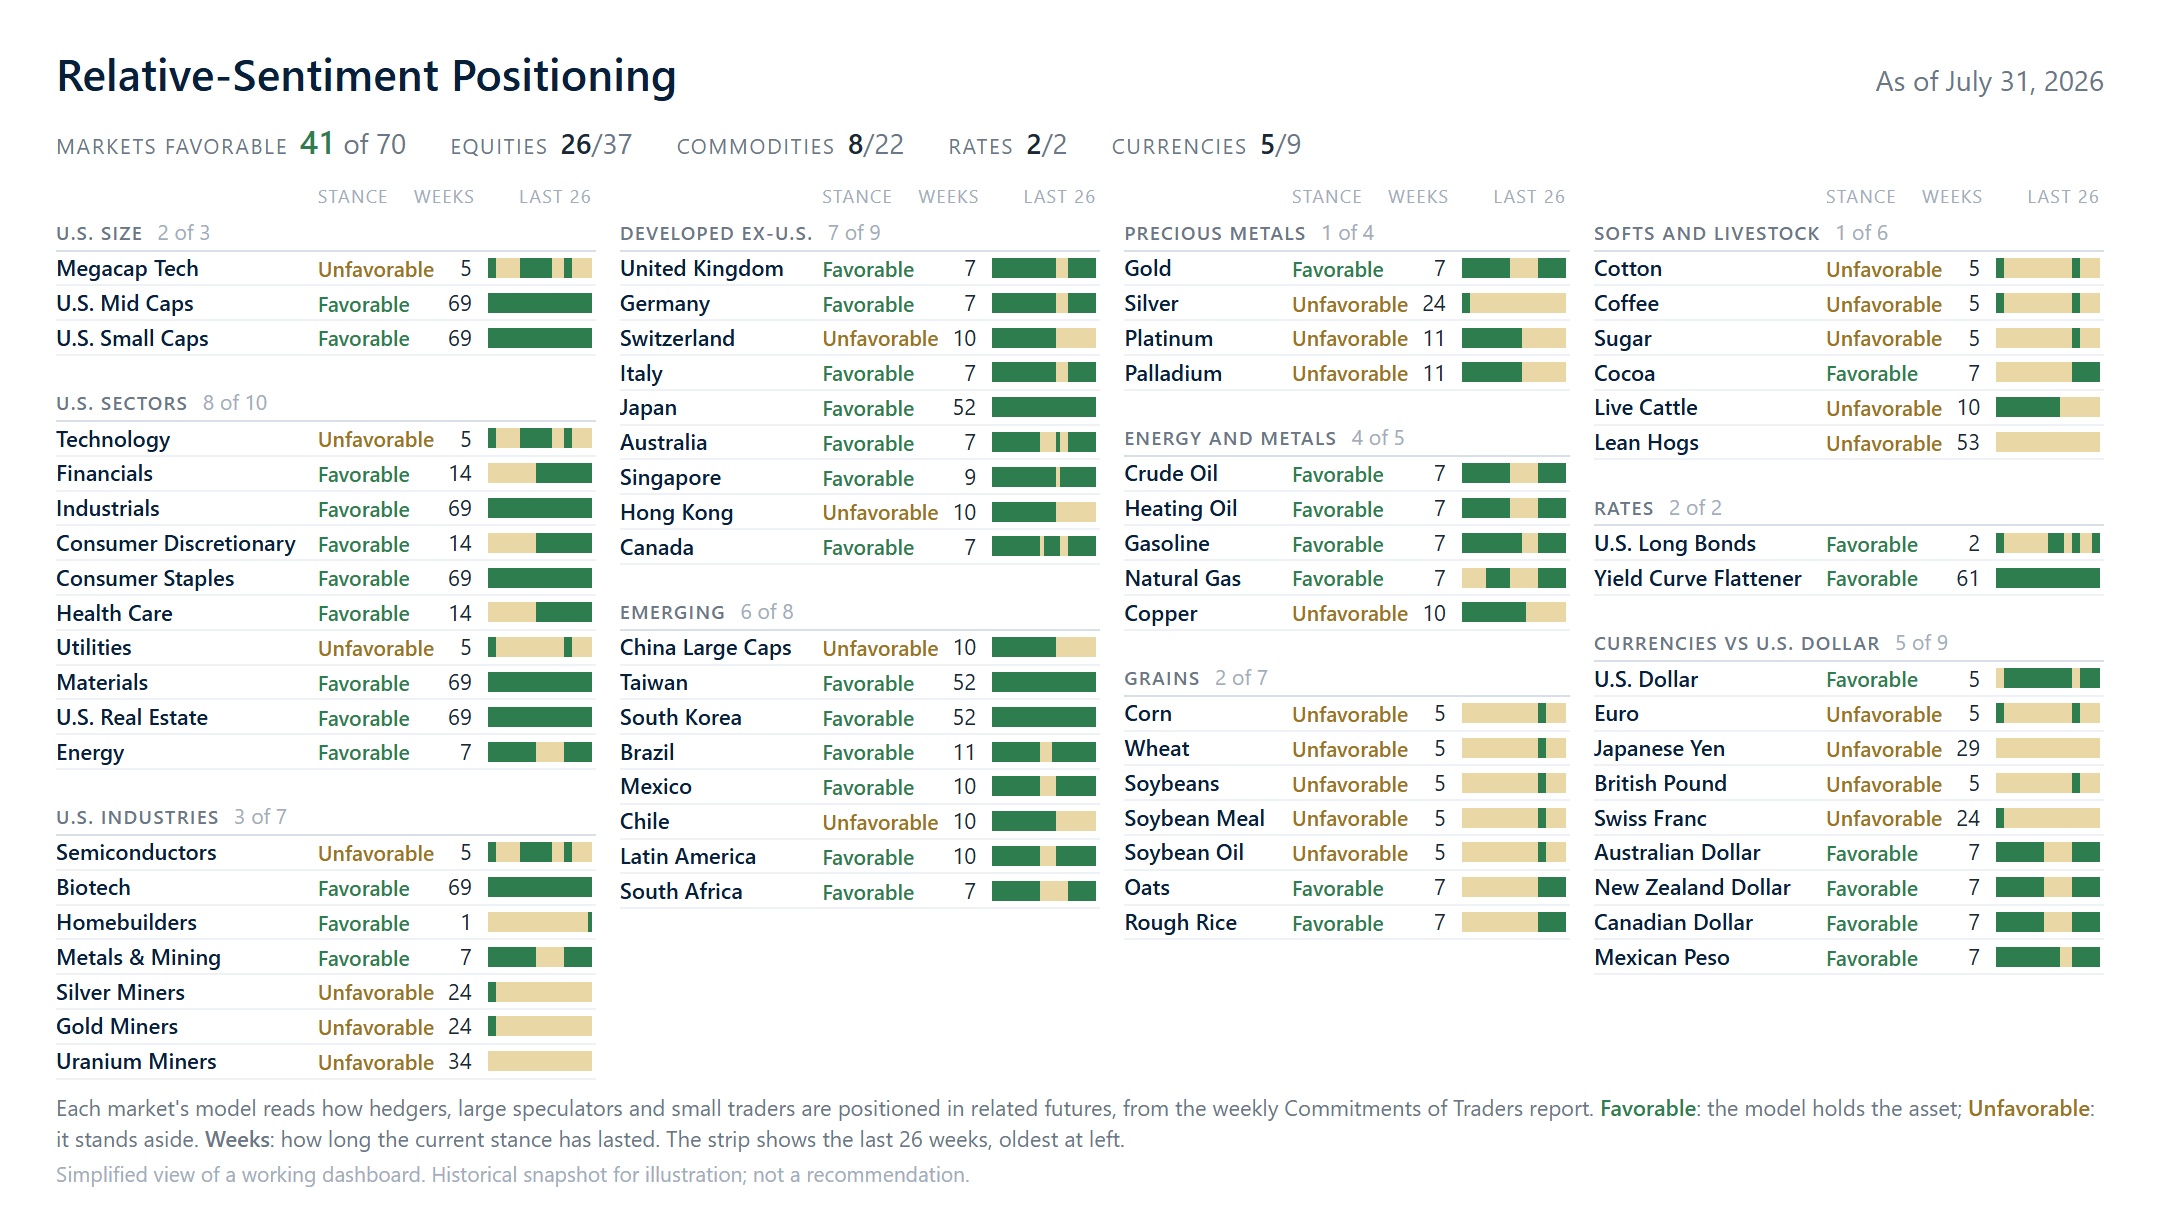
Positioning Dashboard snapshot as of July 31, 2026
Simplified, dated snapshots. Click either one for a closer look on the Engine page.
See the Engine up close →
Our ETF

A go-anywhere tactical ETF that adjusts as relative sentiment shifts.

Our ETF allocates dynamically across global equities, bonds, precious metals, commodities, energy, and the dollar based on relative sentiment, rebalancing when its target allocations shift materially. As an ETF, its tactical adjustments stay inside a tax-efficient wrapper, sparing you the tax friction your own adjustments might otherwise trigger. Live since 2022.

Visit the ETF website →
Many markets, one fund: the ETF moves across asset classes as relative sentiment shifts.
Global Equities The Dollar Commodities Energy Precious Metals Bonds ETF
May also invest in crypto and tail-risk hedges via ETFs.
The Relative Sentiment Report

How the Smart Money is positioned.

Our weekly view of the markets and where positioning stands, delivered to your inbox.

Free. Unsubscribe anytime.